Keyboard Preference Study
Role: UXR, Data Analyst
HP’s hardware team explored a new keyboard design with changes to key layout, spacing, and feel. The research focused on how these modifications influenced typing performance, comfort, and overall usability.
The goal was to provide clear data on user experience, ensuring product decisions balanced innovation with user satisfaction while addressing potential usability concerns compared to HP’s current model and competitor designs.

The Problem
-
HP was exploring a new keyboard design but faced uncertainty about whether users would adapt to it without loss of comfort or performance.
-
While the keyboards had identical key spacing, subtle design differences (e.g., key feel, compactness) could still influence perception and adoption.
-
Without user testing, design decisions could unintentionally compromise speed, accuracy, comfort, or learnability.
Goals
-
Assess how the prototype keyboard compares to HP’s existing design and a competitor keyboard on objective performance measures (typing speed, accuracy, error rate).
-
Capture users’ subjective experience (comfort, fatigue, ease-of-use, preference).
-
Identify trade-offs between efficiency and satisfaction, helping HP weigh innovation against user expectations.
-
Provide actionable, evidence-based recommendations for refining the keyboard design before production.
Research Questions
-
How do typing speed, accuracy, and consistency differ across the HP designs and the competitor keyboard?
-
What are users’ subjective experiences with comfort, ease-of-use, and perceived usability for each keyboard?
-
Which design elements drive preference or frustration when objective performance is equivalent?
-
How can HP balance innovation in design with user expectations for familiarity and comfort?
Methods
-
Participants: 22 users recruited via convenience sampling.
-
Design: Within-subjects usability study; each participant tested all three keyboards in a counterbalanced order to reduce sequence effects.
-
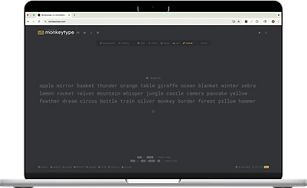
Task: Standardized typing test using MonkeyType.com.
-
Metrics (Quantitative): Typing speed, raw speed, accuracy, completion time, and consistency.
-
Metrics (Qualitative): Likert-scale usability ratings and open-ended feedback on ease-of-use, comfort, and issues.
-
Analysis: Statistical testing for quantitative data; thematic/content analysis for qualitative feedback.
Results


-
Quantitative:
-
No statistically significant differences in typing speed, accuracy, or consistency across the three keyboards.
-
-
Qualitative:
-
One HP keyboard was the most positively reviewed — described as “comfortable,” “normal feeling,” and “easy to type on.”
-
-
The prototype received the most negative feedback, despite identical spacing to the other designs.
-
The competitor was rated hardest to use by many participants, but still drew fewer negative comments than the prototype.
-
Preferences: More participants selected the familiar HP keyboard as easiest to use compared to the prototype.
Impact
The study demonstrated that performance metrics alone cannot predict user satisfaction. While all keyboards performed similarly in speed and accuracy, comfort and familiarity strongly shaped preference. Findings provided HP with:
-
Evidence that the familiar design is most user-preferred.
-
Clear signals that the prototype requires refinement (e.g., key feel, travel, tactile response) before release.
-
A validated mixed-methods approach (quant + qual) to guide future design testing.
Ultimately, the study reinforced the importance of user-centered evaluation in hardware design and helped HP identify opportunities for iterative refinement before product rollout.